Log traces during model training runs
Use Weave Panels
By decorating the functions with@weave.op in your ML-pipelines, you automatically capture their execution information and access it in a personal workspace.
For example, the following script demonstrates how Weave traces integrate with W&B training runs. It simulates a machine learning training loop where each training step logs metrics to W&B while simultaneously creating detailed Weave traces. The @weave.op decorators on the functions automatically capture inputs, outputs, and execution details. When the training loop logs metrics with wandb.log(), it also logs Weave trace information to your project.
wandb: 🚀 View run at https://wandb.ai/wandb/my-project/runs/<run-ID>) or navigate to the workspace in the UI.
To navigate to a workspace from the UI:
- Open the W&B UI and click the Projects tab. This opens a list of your projects.
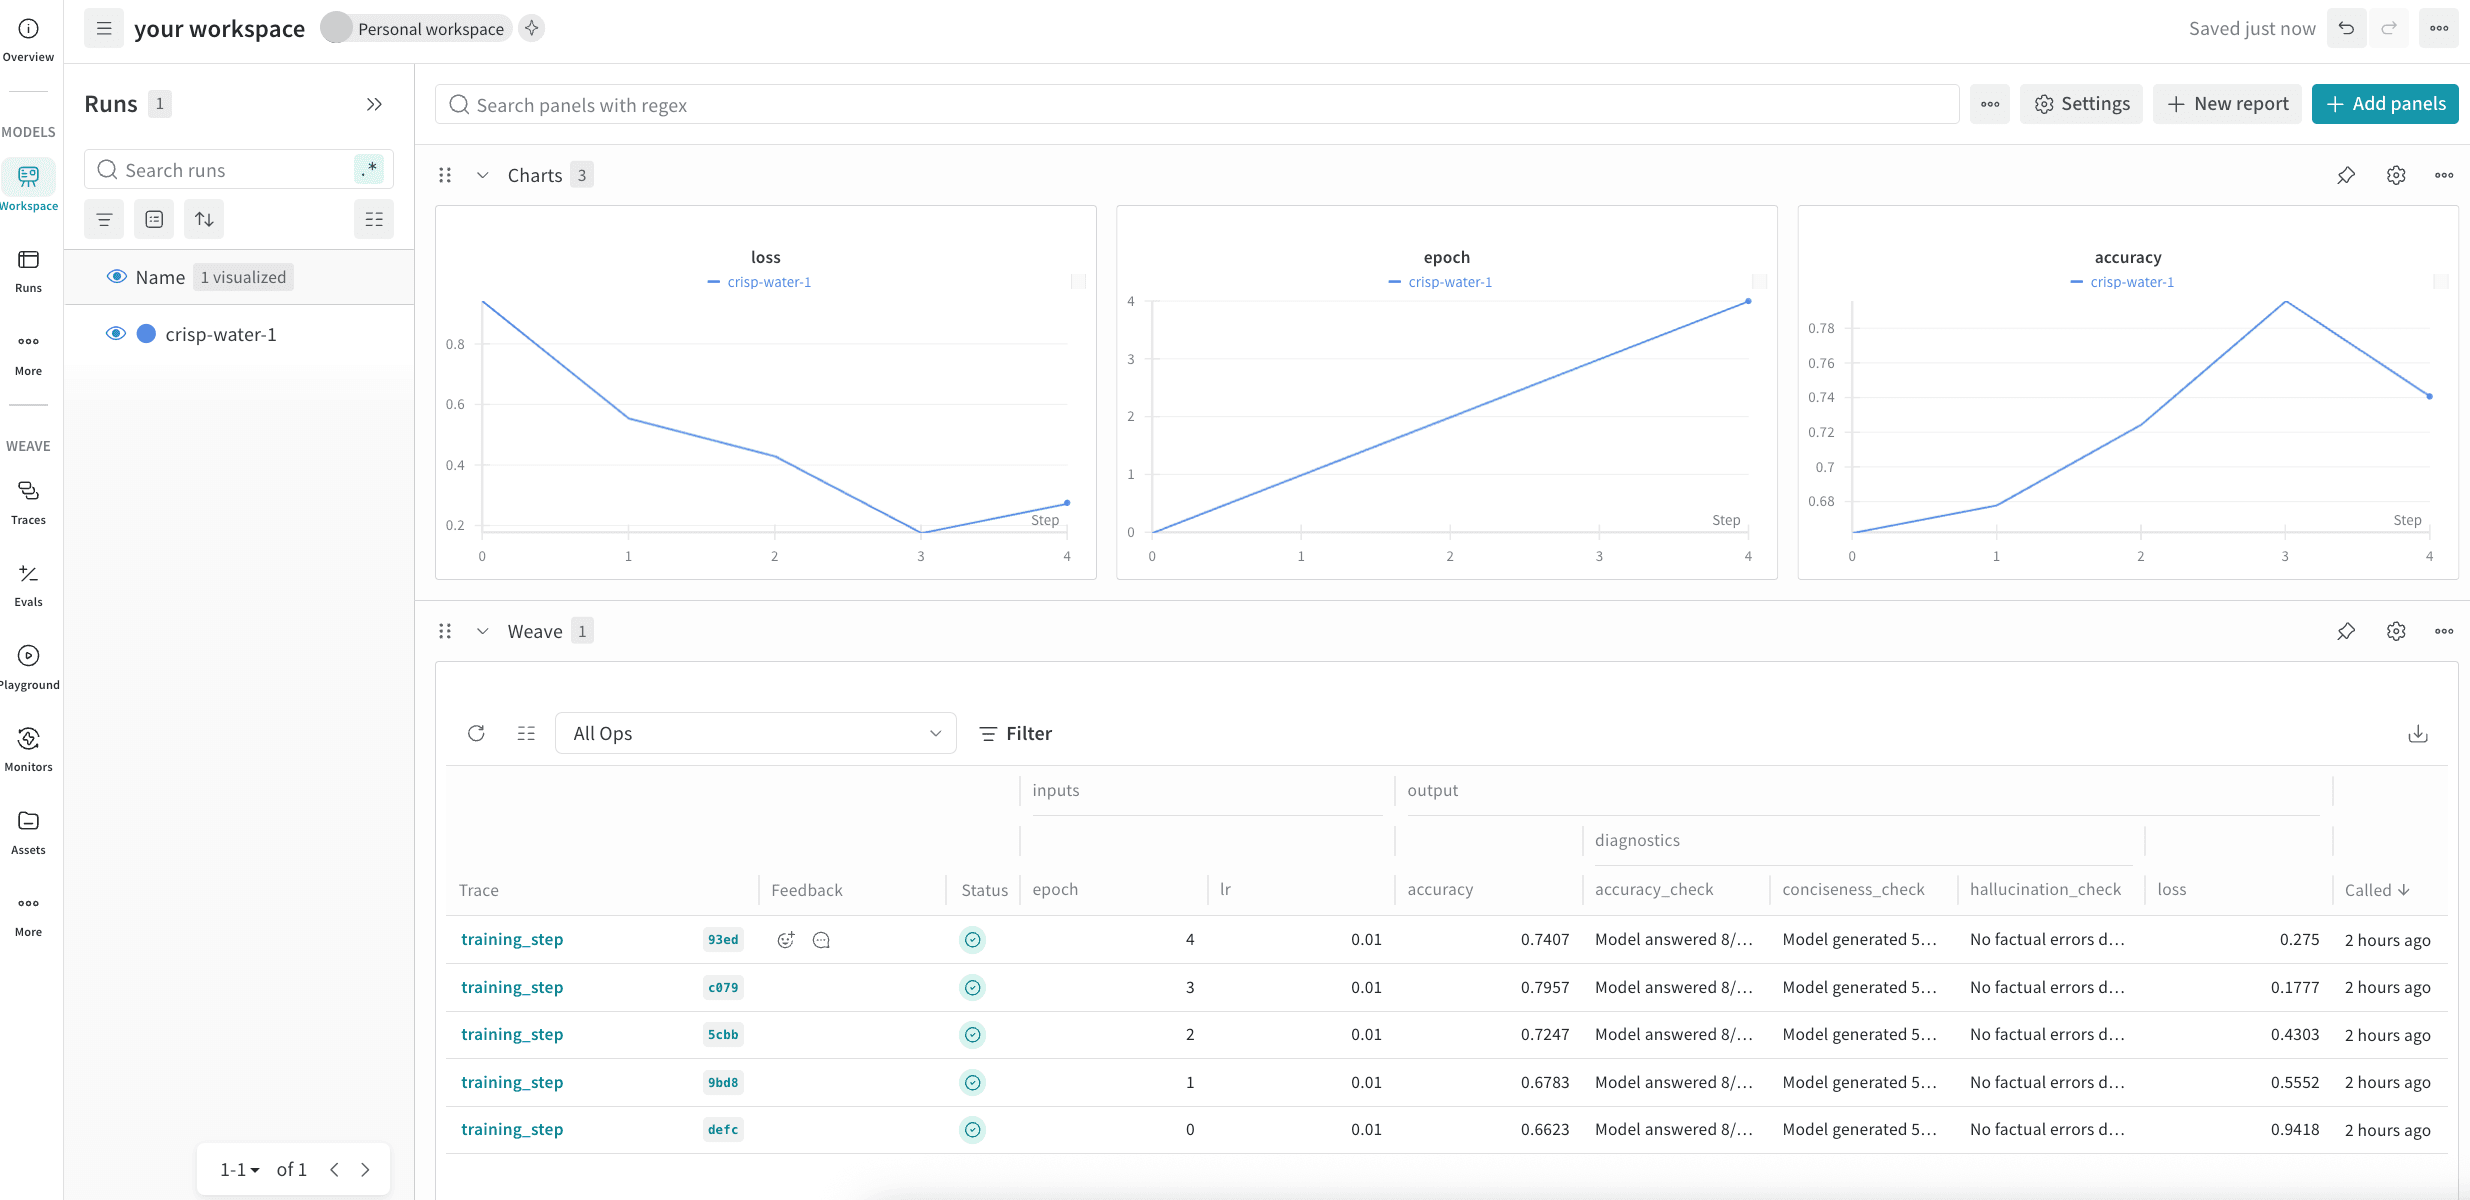
- From the list of projects, click the project that you logged your run to. This opens the Workspaces page.
- If you’ve set up your workspace as an automatic workspace, the workspace automatically populates with data visualizations and information about your run. The trace data for your run is under the Weave section of the workspace. If your workspace is a manual workspace, you can add Weave panels to by clicking Add panels and selecting new panels from the Weave section of the Add Panels menu.